Using OpenStreetMap data to assess the bikeability of schools
![]()

Harald Kliems 
UW–Madison Prevention Research Center
UW–Madison School of Medicine and Public Health, Dept. of Pediatrics
Samuel Younkin
UW–Madison Nelson Institute for Environmental Studies
Link to the slides

https://haraldkliems-sotmus-2026.share.connect.posit.cloud/
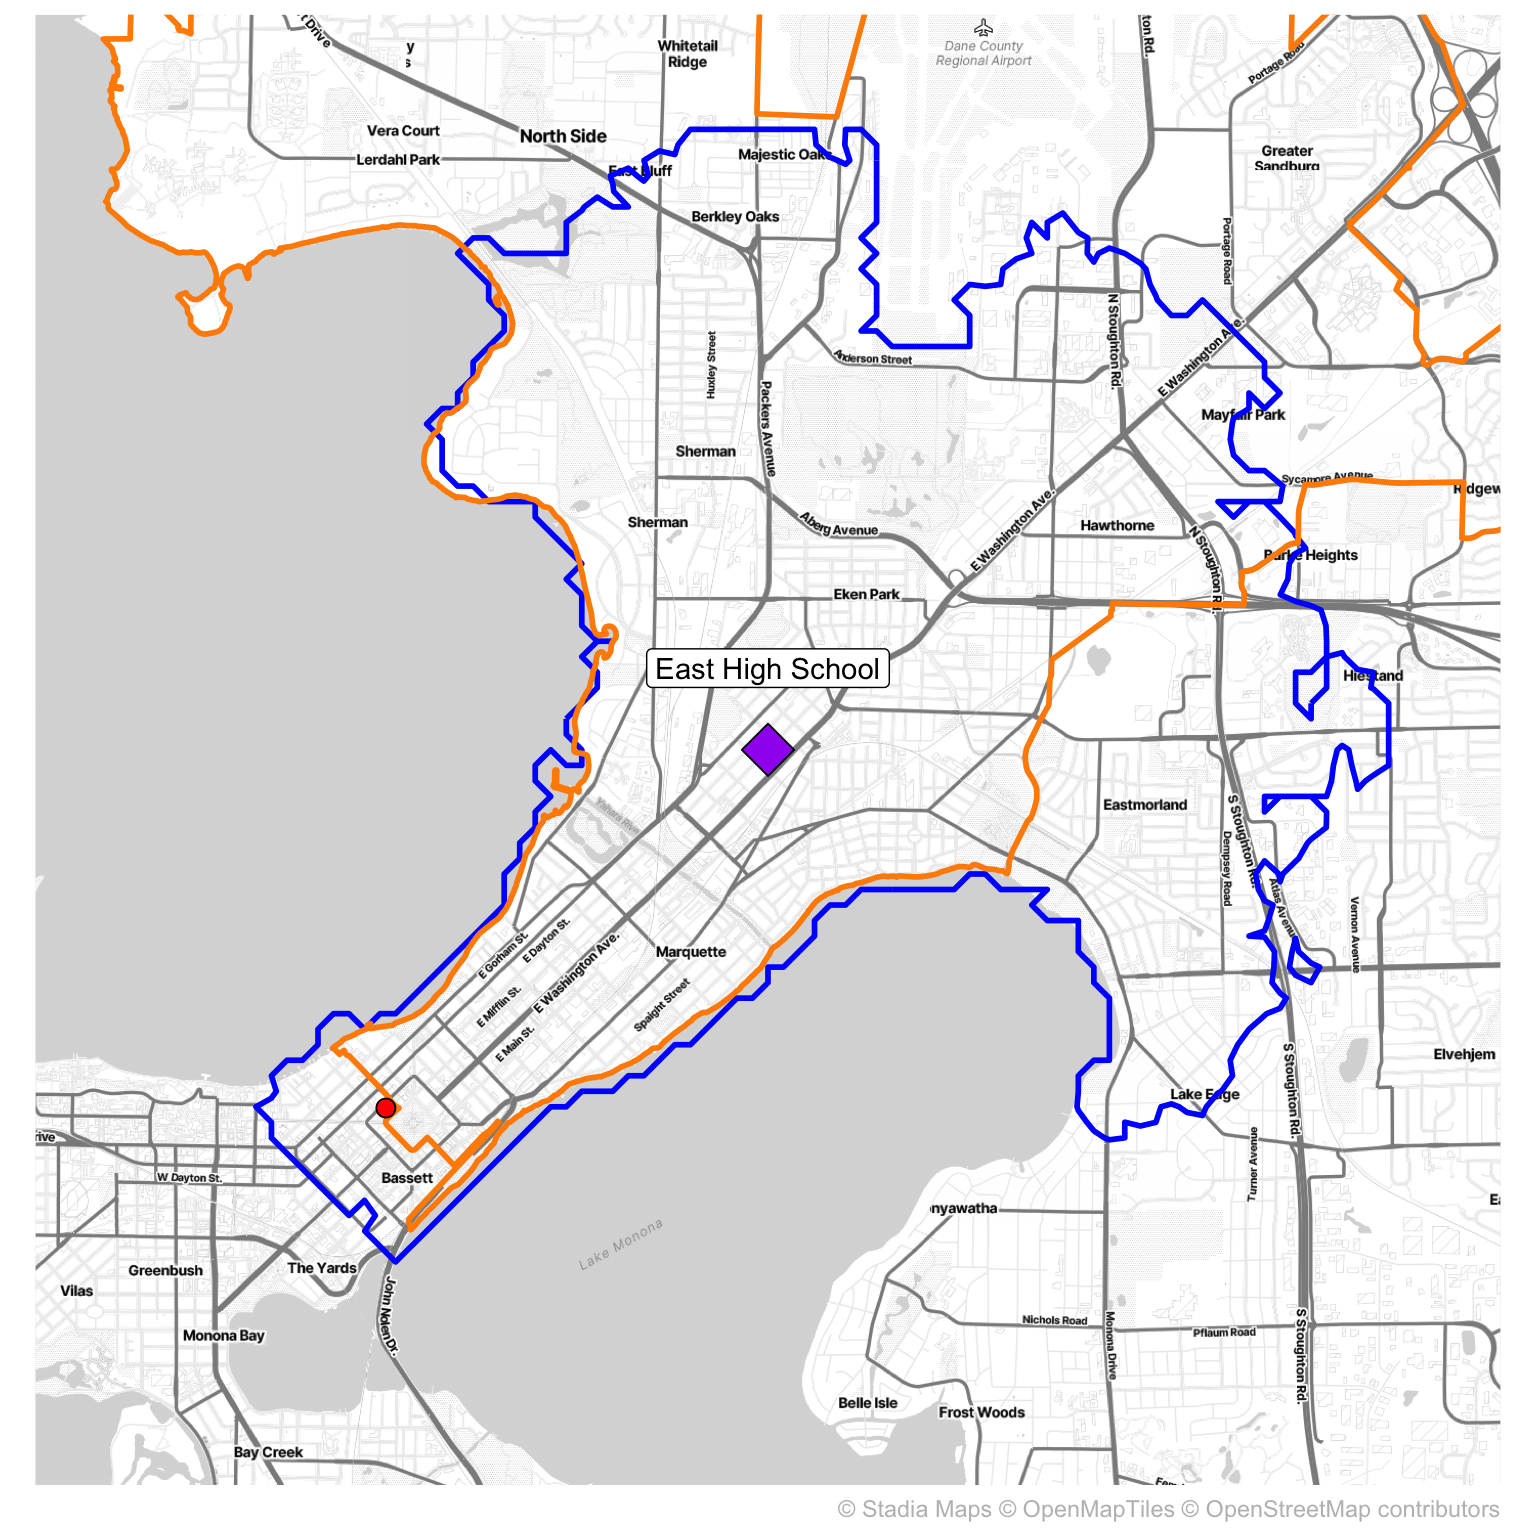
Census data and grid cells
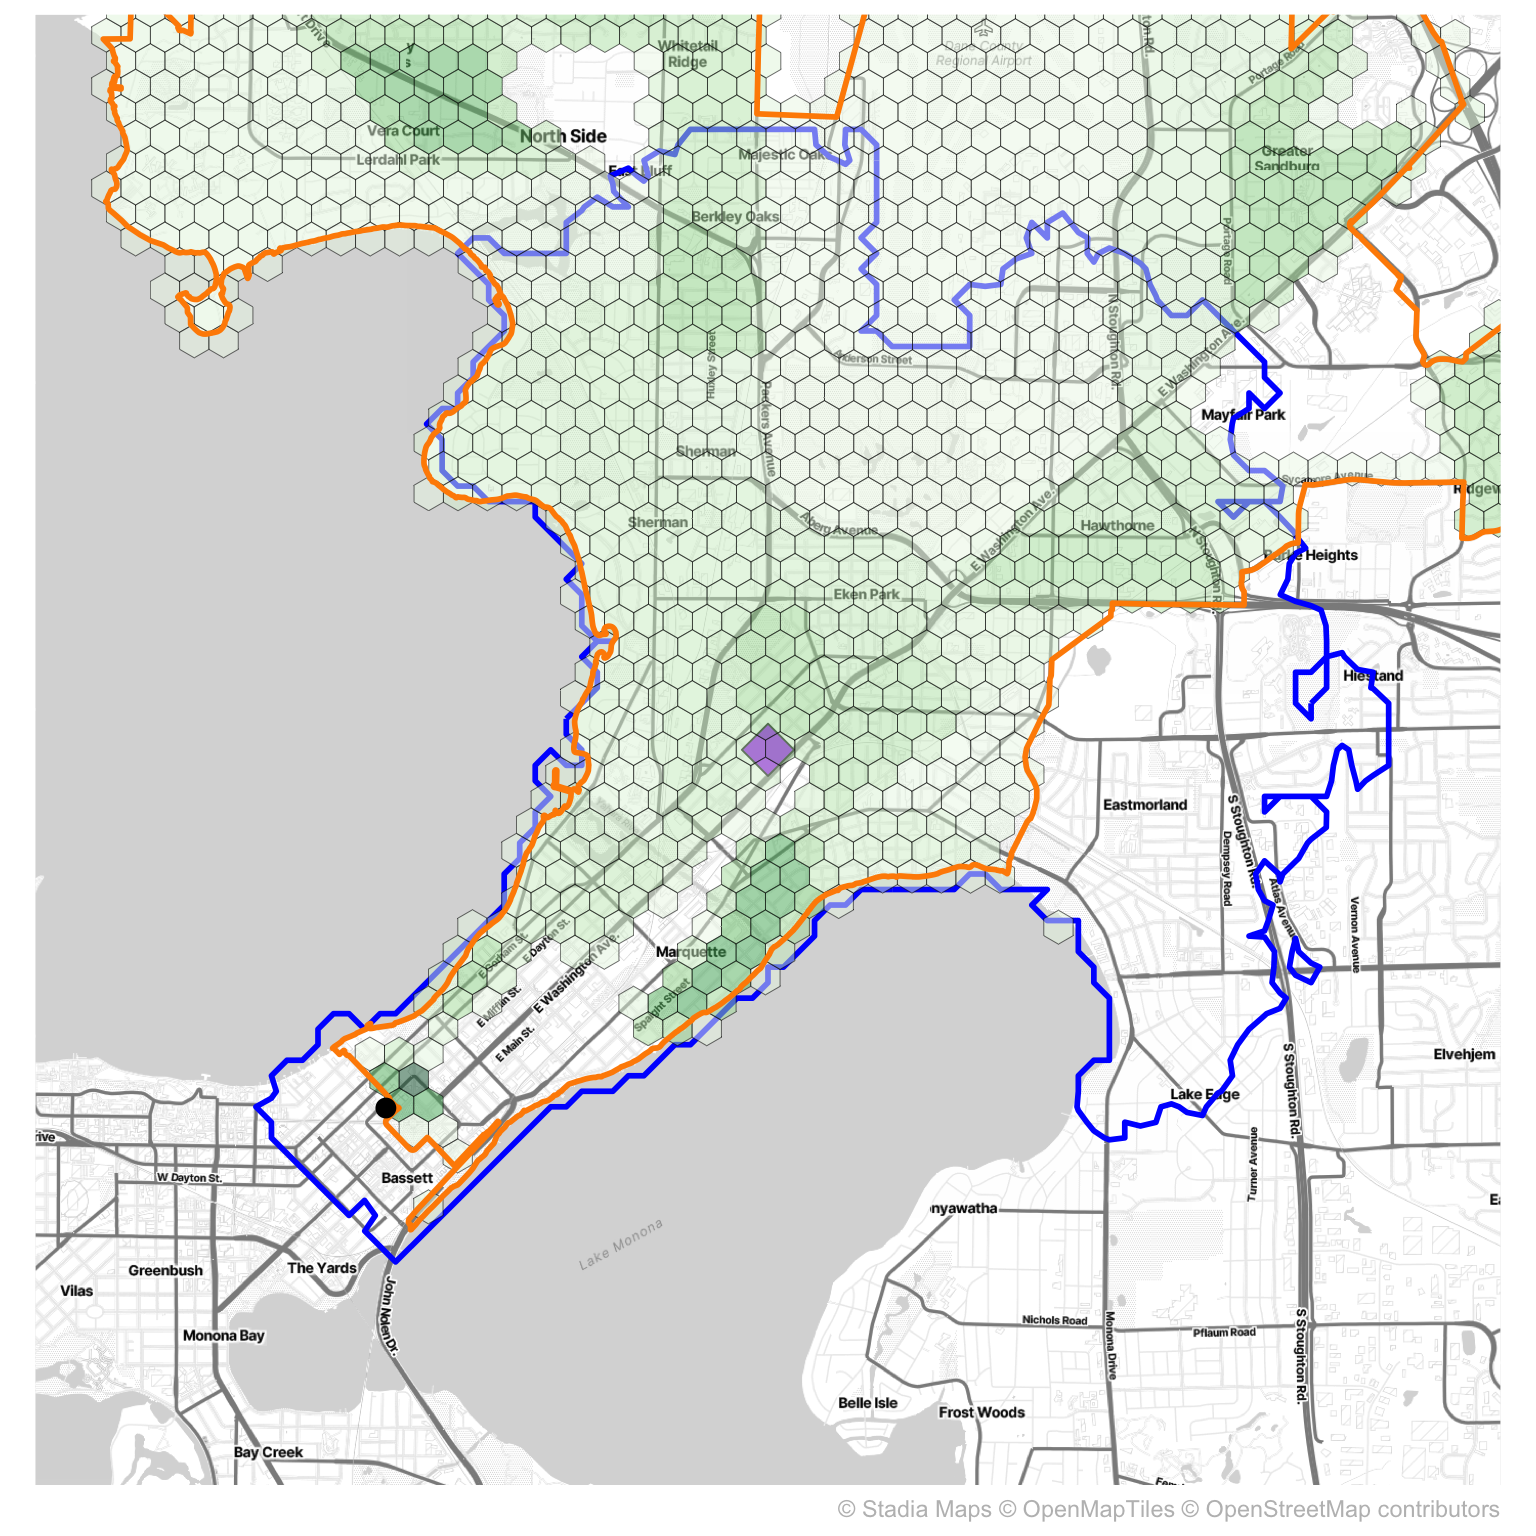
- Student population from American Community Survey
- Uses bike and attendance areas to “assign” cells to schools
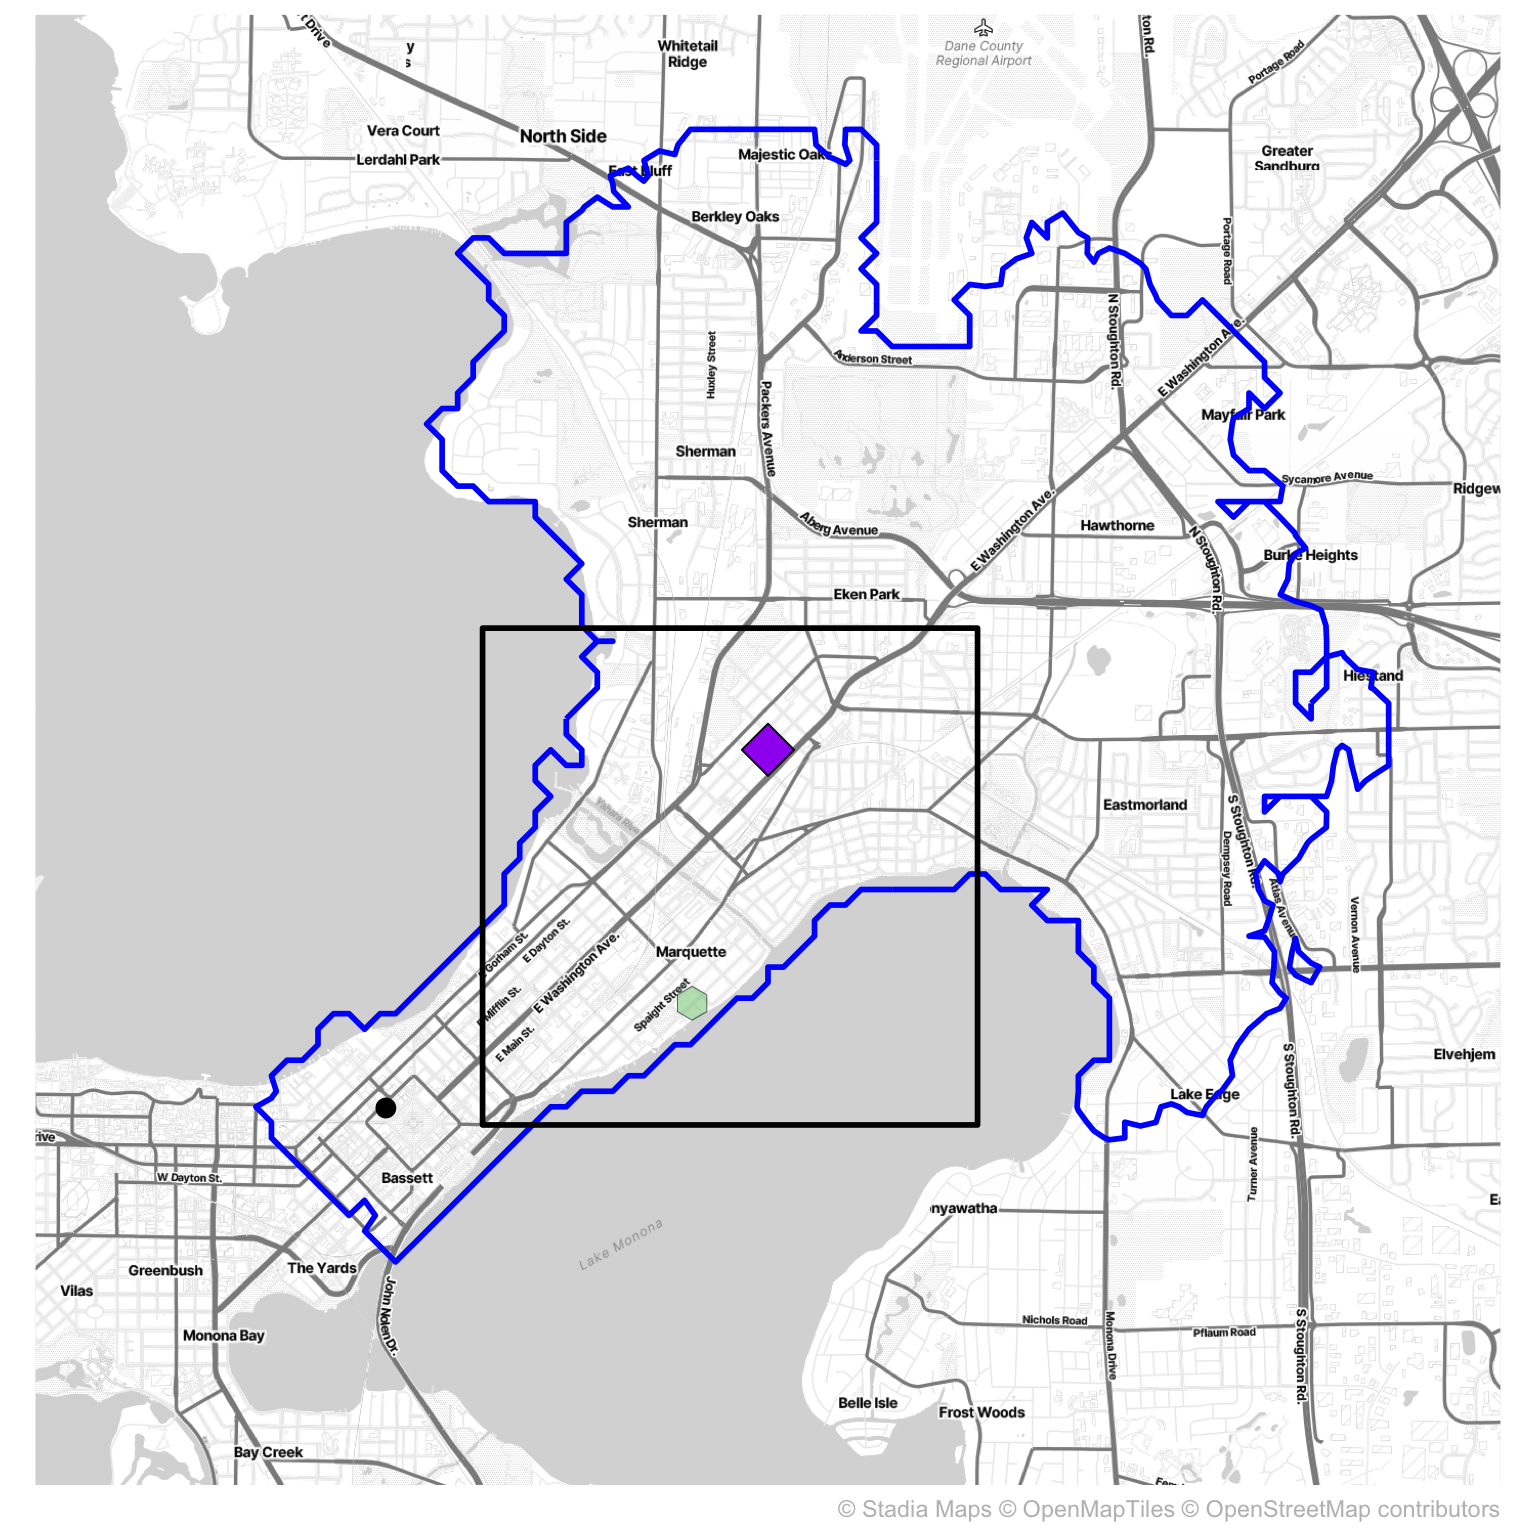
Zooming in
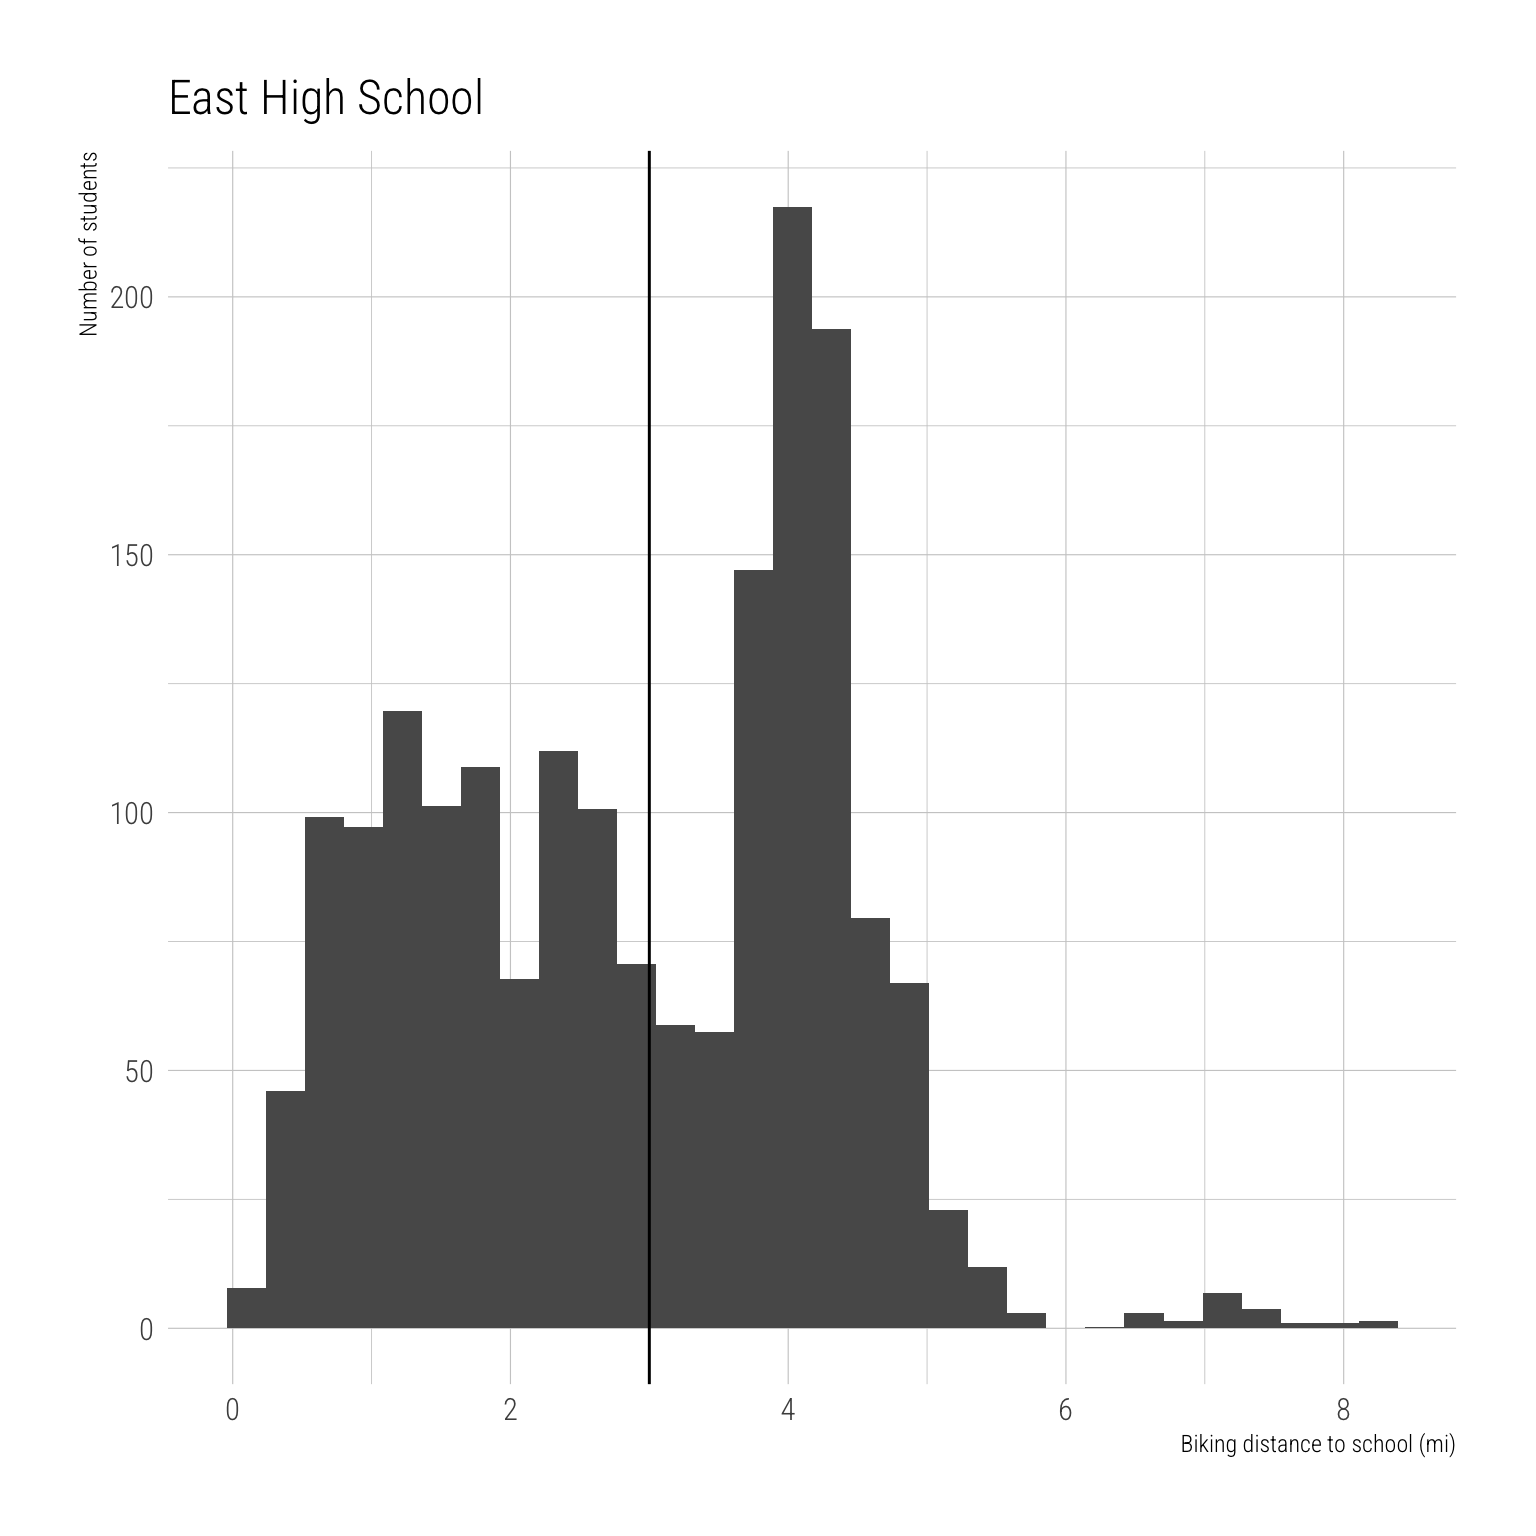
Routing with BRouter
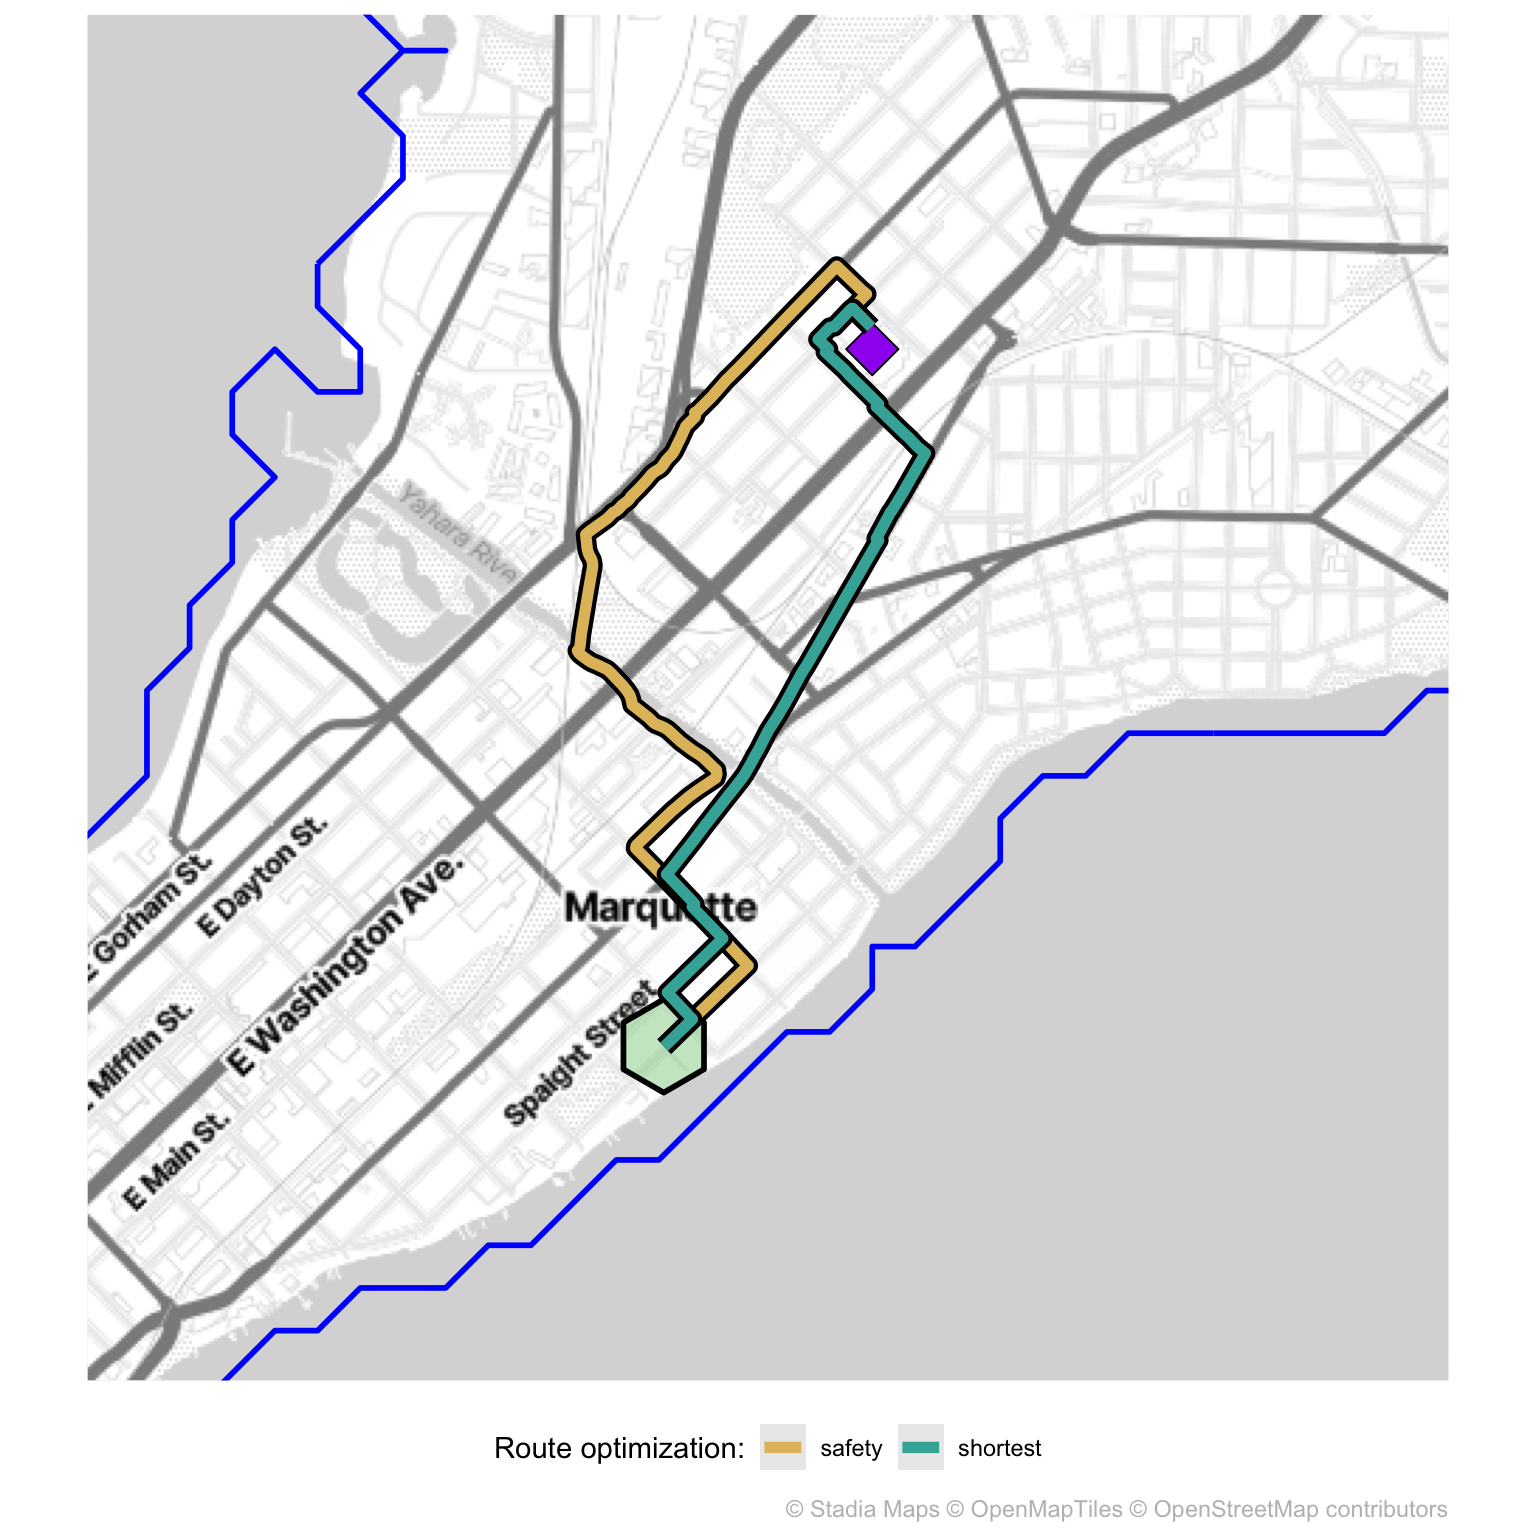
- Routing with BRouter
- Calculate routes with two profiles:
safety&shortest
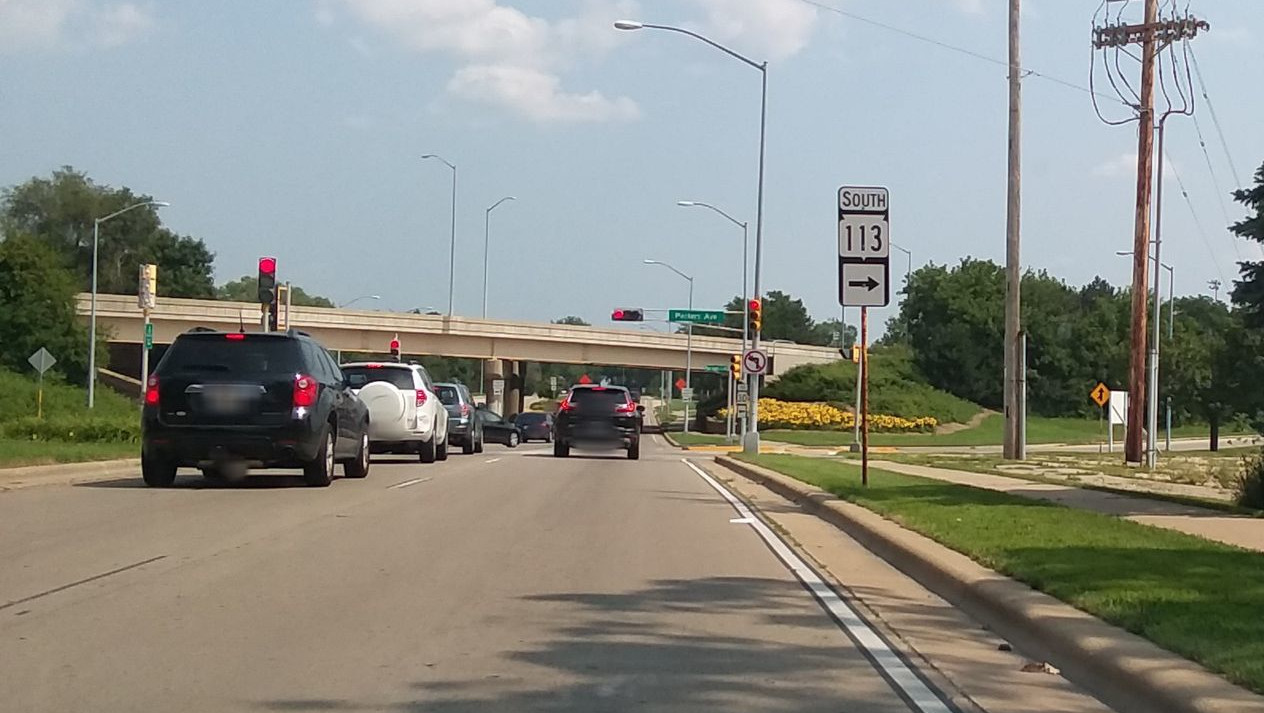
Traffic stress with BrokenSpoke Analyzer
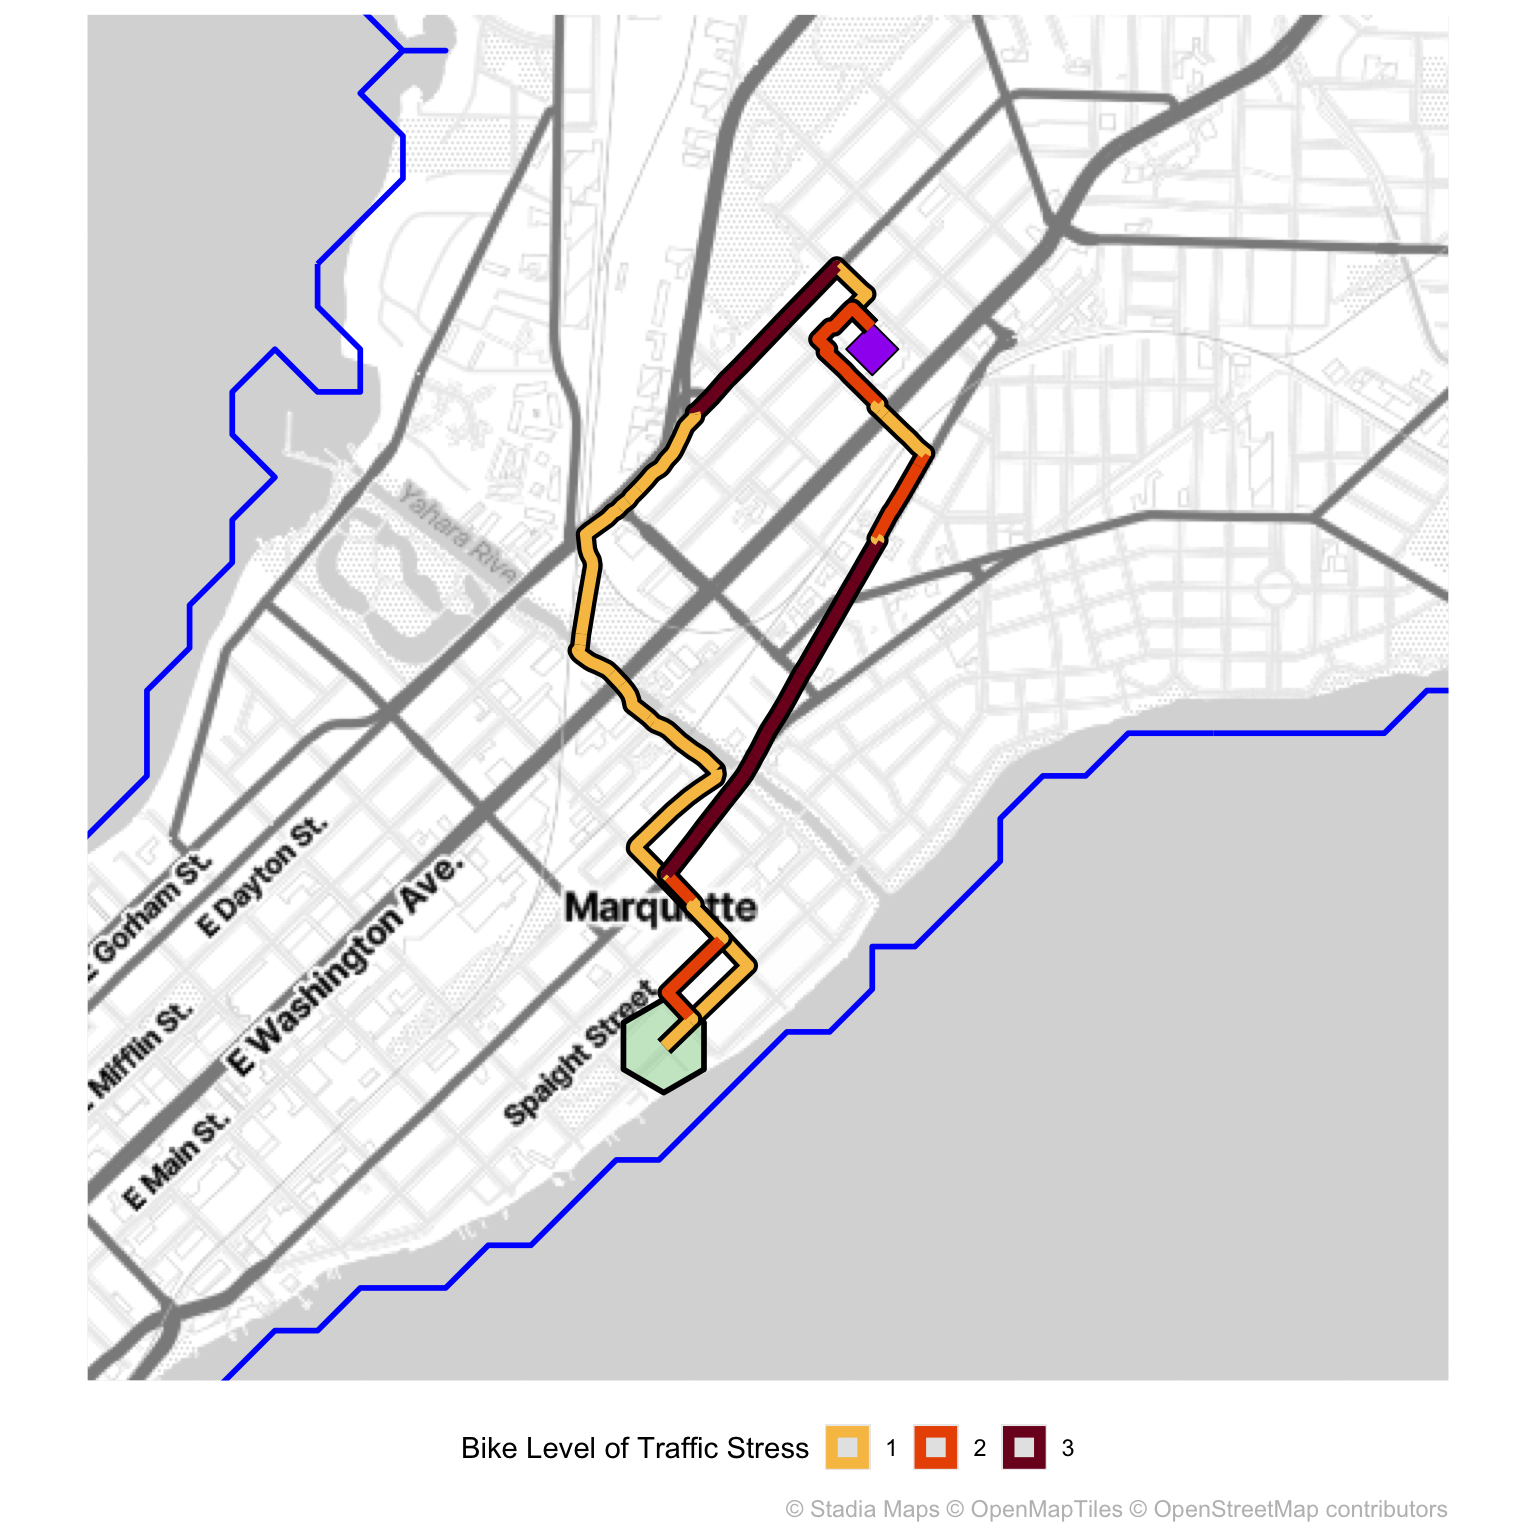
- Bike Level of Traffic Stress classification w/ BrokenSpoke Analyzer
- BrokenSpoke Analyzer powers the People for Bikes Bicycle Network Analysis
- Classifies segments and intersections into high stress or low stress
- Based on number of lanes, posted speed limit, type of bike lanes, signals, etc.
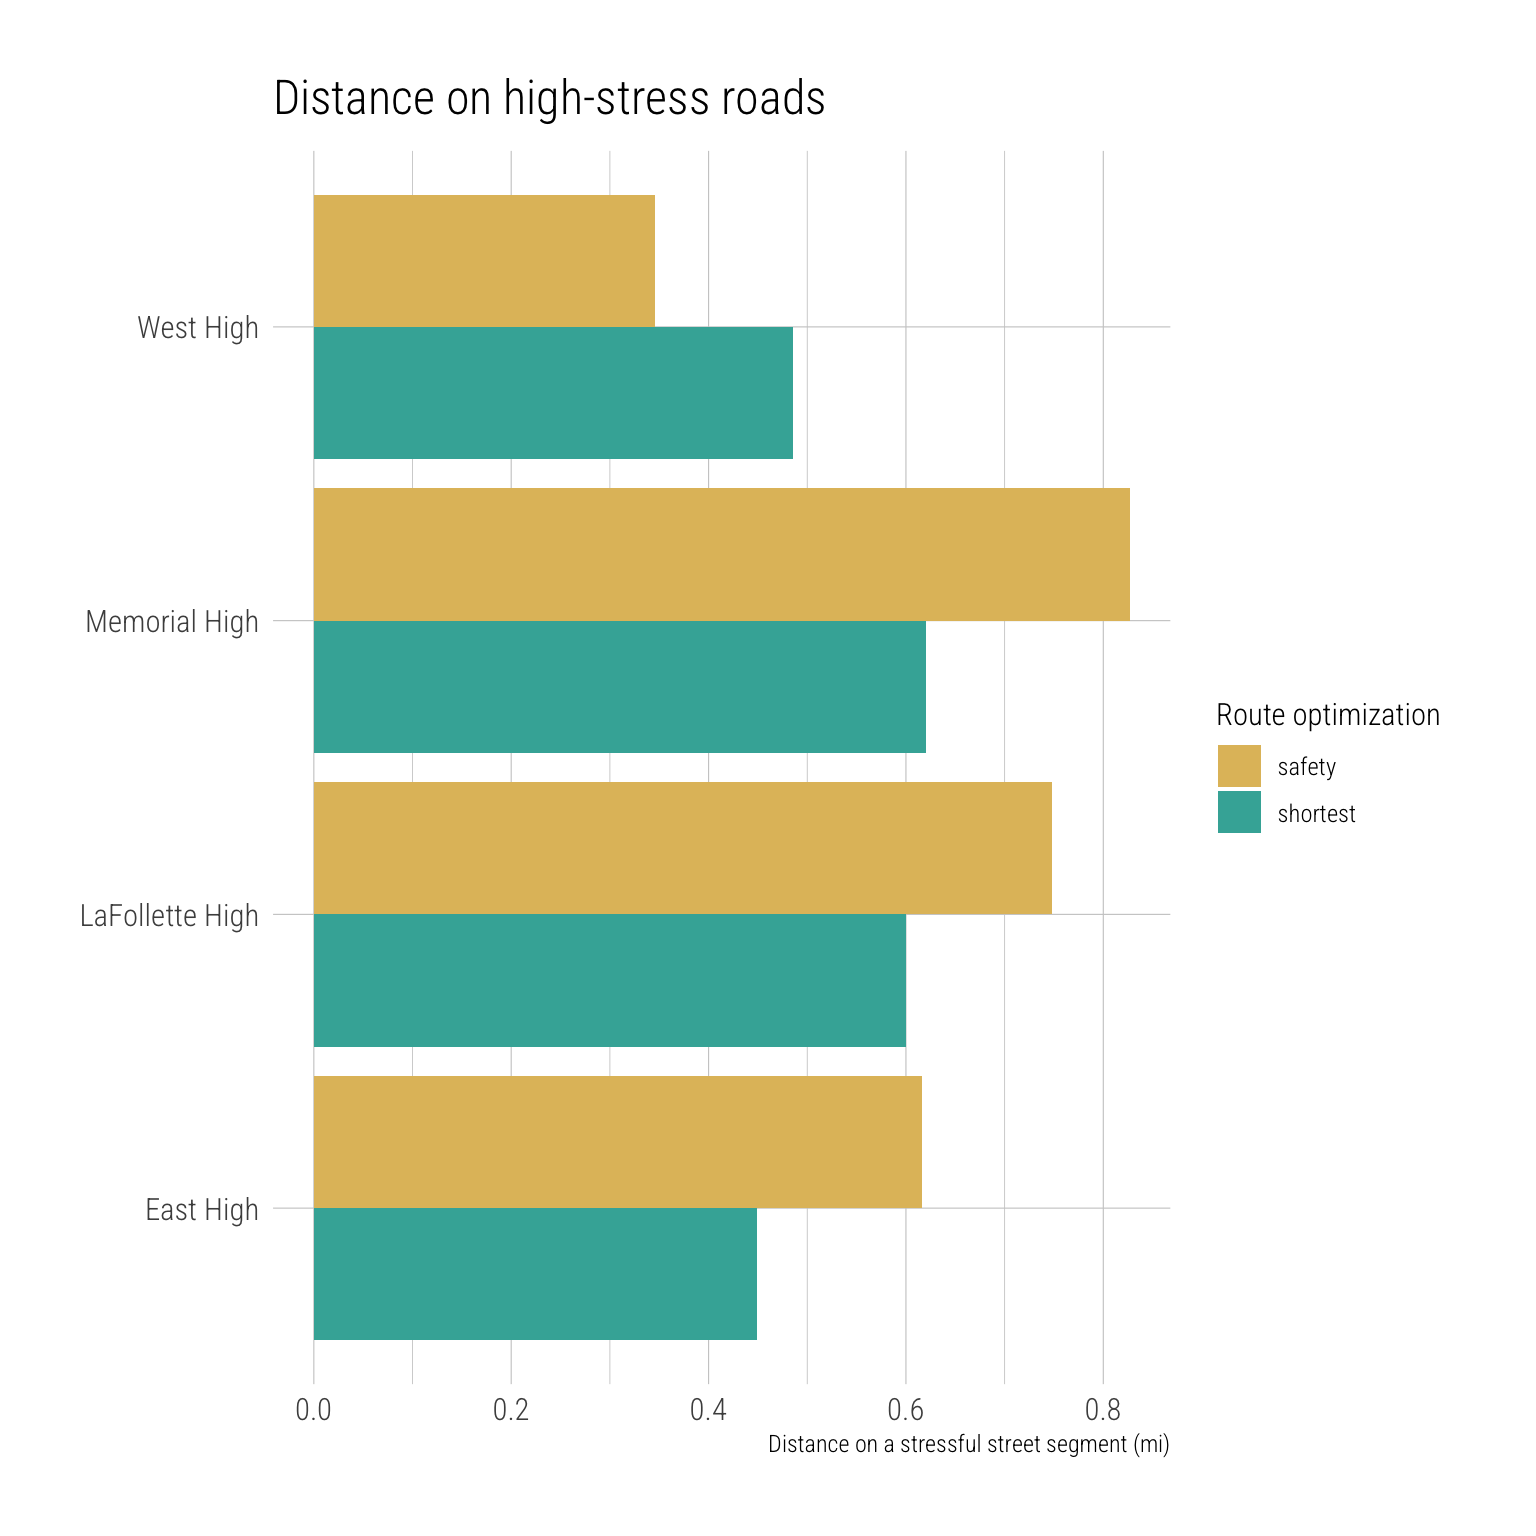
Aggregate routes
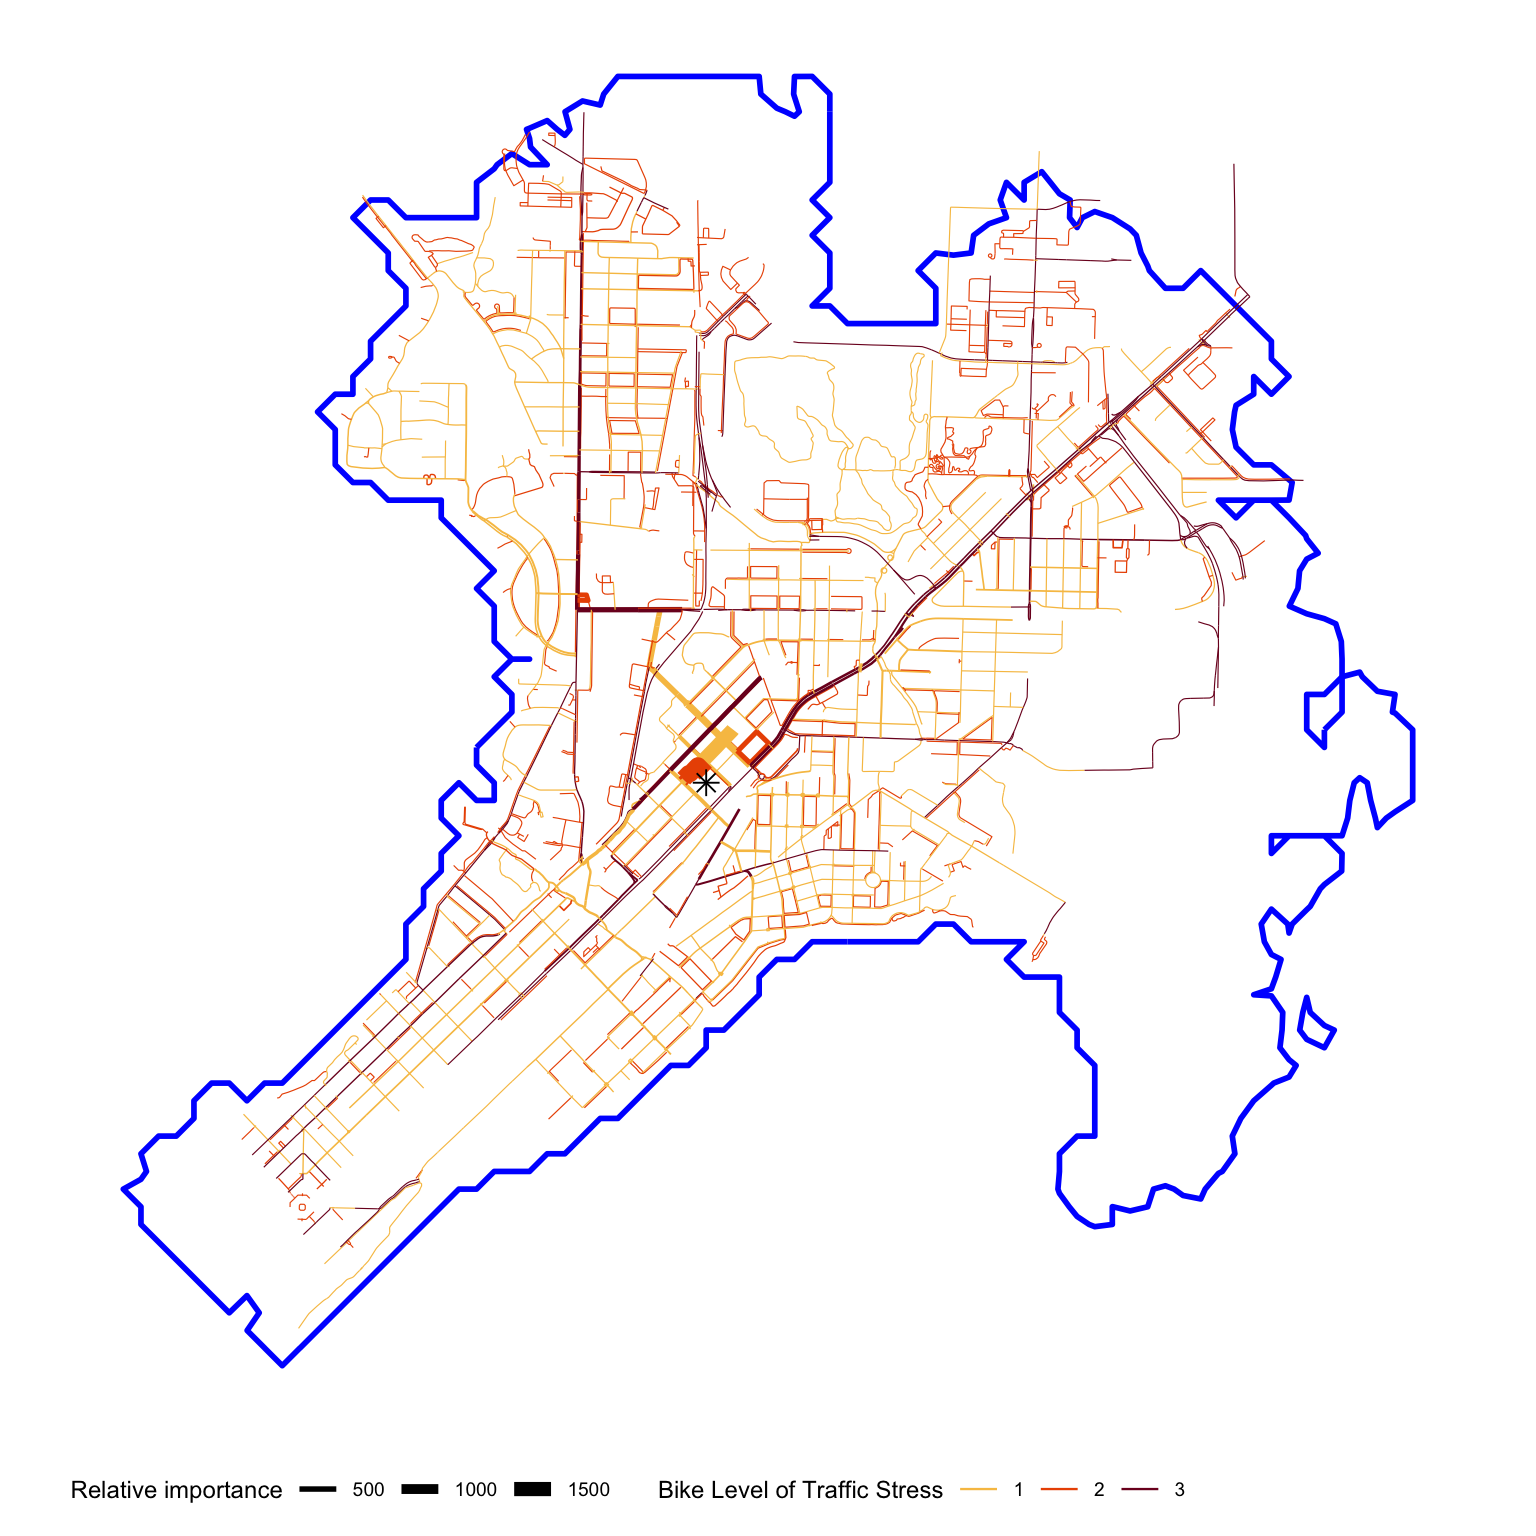
- Prioritizing limited resources to best help kids bike to school.
- Which streets are the biggest barriers to the most students?
Aggregate across schools & district
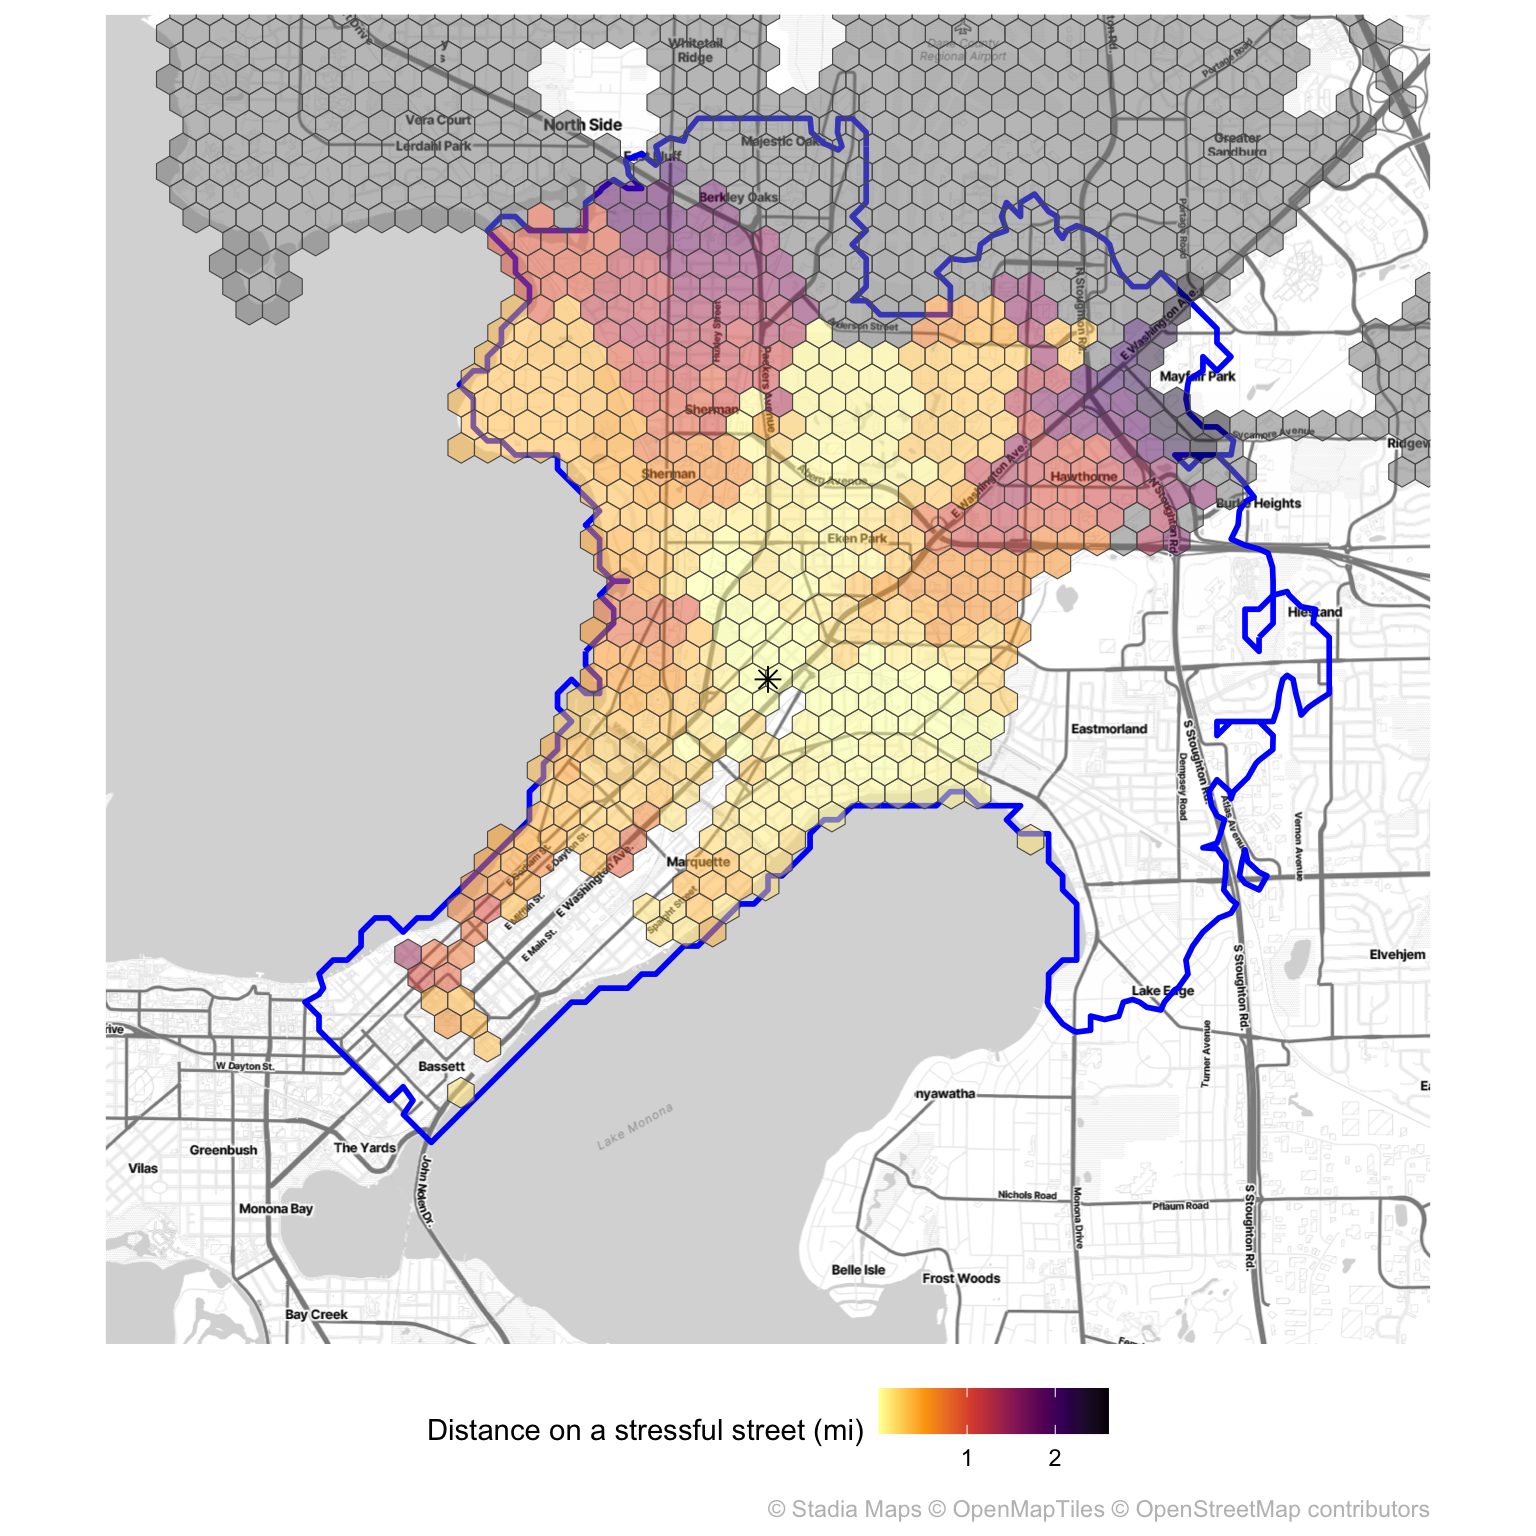
- In which neighborhoods is biking to school the most dangerous?
- Can guide building new schools and housing density
Aggregate across schools & district
- Prioritize education and encouragement efforts.
- Which schools have high bike potential?
- How does bikability relate to other social characteristics?
What-if analysis
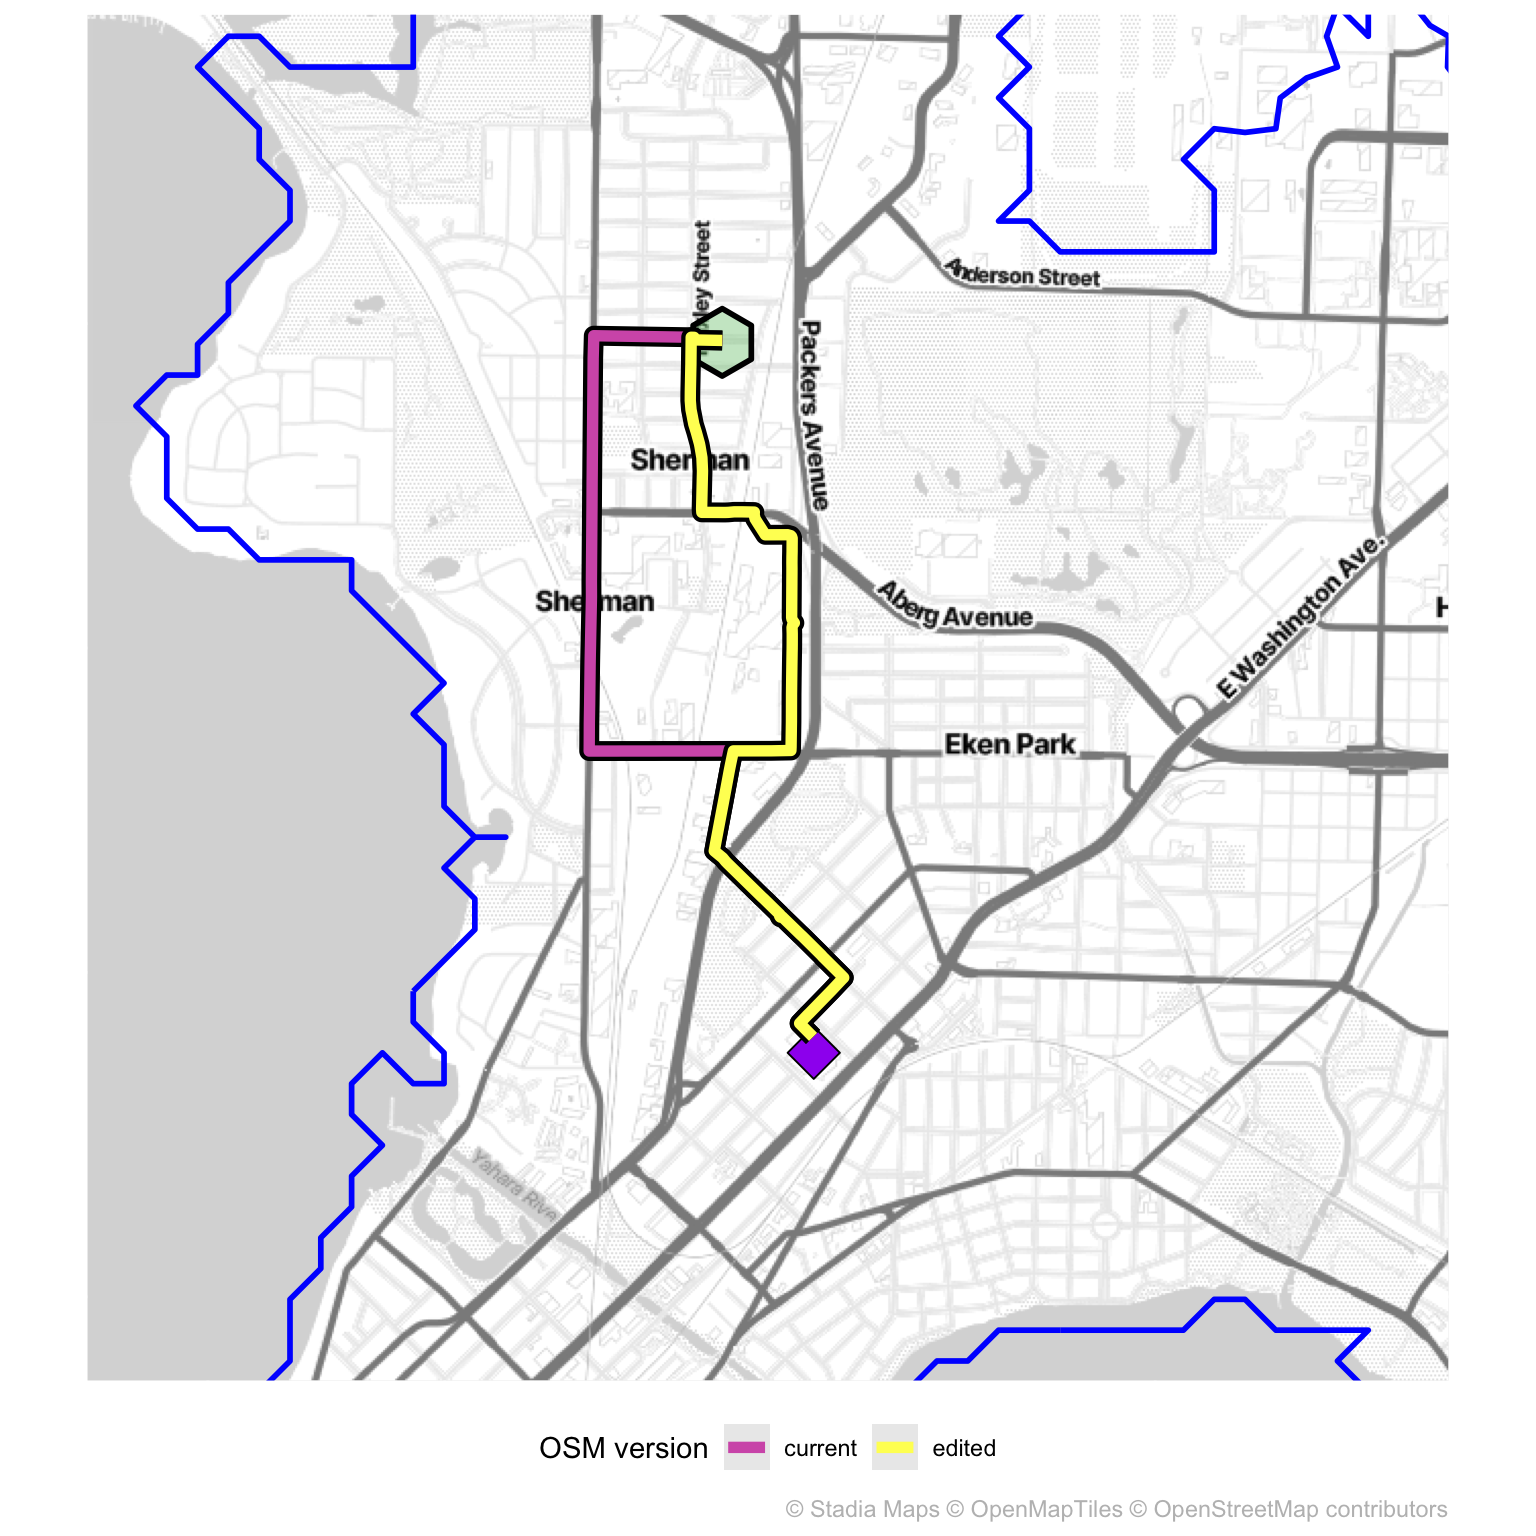
- Routing is done locally using an .osm.pbf file, editable!
- Using osmChange files, looking for better workflow
- How many students will be impacted by a change?
- Focus groups with high school students to identify barriers
Acknowledgments
This research was funded through a pilot grant from the Center for Health, Energy, and Environmental Research (CHEER; NIH grant #1P20ES036747-01). We thank all the high school students involved in the project for their contributions!
Talk to us!
Reach out:
- kliems@wisc.edu
- ben@wisconsinbikefed.org
- syounkin@wisc.edu